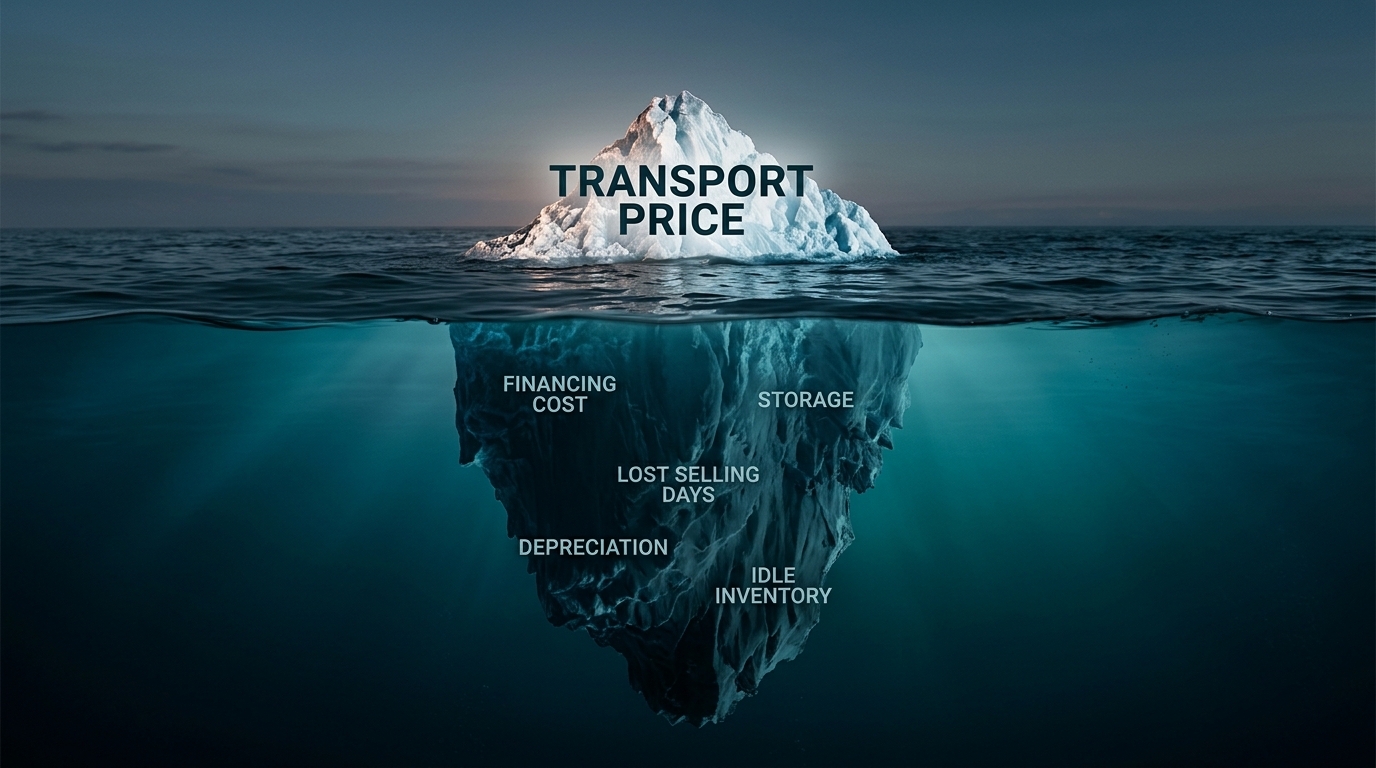
Je vergelijkt drie transportoffertes voor dezelfde rit en kiest de goedkoopste. Logisch, want de transportprijs staat zwart-op-wit op de factuur. Maar de dagen die de auto daarna verliest, wachtend op inplanning of onderweg, staan nergens op die factuur. En die dagen kosten vaak meer dan het verschil tussen de goedkoopste en de snelste offerte.
In een occasionmarkt die drukker en transparanter wordt, is dat geen theoretisch punt. Het is het verschil tussen marge behouden en marge verliezen aan een auto die net iets te lang onderweg is.
Waarom de occasionmarkt drukker en competitiever wordt
De gebruikte-automarkt staat niet stil, en dat zie je in heel Europa terug, alleen niet overal op dezelfde manier. In Duitsland wisselden in 2025 ruim 6,5 miljoen auto's van eigenaar, blijkt uit cijfers van de Kraftfahrt-Bundesamt, met een sterke eindsprint in december. In Frankrijk bleef de occasionmarkt met 5,4 miljoen transacties nagenoeg stabiel, en vangt daarmee volgens marktonderzoeker AAA Data juist de zwakte in de nieuwverkoop op: 78% van de jongere occasions (tot 5 jaar) wordt inmiddels via professionals verkocht. Nederland brak in 2025 met 2,1 miljoen verkochte occasions een record, aldus BOVAG.
Meer volume betekent niet automatisch meer marge, eerder het omgekeerde. In Nederland daalde de gemiddelde winst per dealervestiging in het eerste kwartaal van 2026 met bijna een kwart: van €69.117 naar €52.646. In Duitsland ligt de gemiddelde omzetmarge van dealers inmiddels rond de 1,1%, opnieuw lager dan het jaar ervoor, ondanks 4,5% meer omzet. In Frankrijk is het beeld nog scherper: de gemiddelde rentabiliteit van dealernetwerken zakte in 2025 naar zo'n 0,08%, tegen 0,46% een jaar eerder, het zesde jaar op rij dat die rentabiliteit daalt. Drie markten, hetzelfde patroon: meer auto's die verhandeld worden, minder marge per auto. Bij rendementen op dat niveau hoeft een logistieke vertraging geen honderden euro's per auto te kosten om er toch toe te doen. Op portefeuilleniveau telt elke vermijdbare dag.
Dat betekent niet dat de markt overal in Europa op dezelfde manier groeit. Ontwikkeling verschilt per land en per segment: waar de ene markt vooral in volume groeit, staat de marge in een andere juist onder druk. Wat wél overal terugkomt, is dat dealers en fleetowners steeds meer in omloopsnelheid denken, niet alleen in losse transacties. Een auto die sneller van inkoop naar verkoop beweegt, is een auto die minder blootstaat aan marktbewegingen die je niet in de hand hebt.
De transportprijs staat op de factuur. De wachtkosten niet.
Een transportofferte is een concreet bedrag. De kosten van wachten zijn dat niet. Ze zijn verspreid over financiering, opslag en gemiste verkoopdagen, en daardoor makkelijk te missen, ook al zijn ze net zo reëel.
Wat één extra stilstandsdag echt kost
Een eenvoudig rekenvoorbeeld maakt dat concreet. Een auto van €25.000, gefinancierd tegen 3,6% op jaarbasis, kost je ruwweg €2,47 aan kapitaalbeslag per stilstandsdag. Bij 500 auto's in voorraad is dat €1.233 per extra dag voor de hele voorraad. Vijf vermijdbare dagen over die 500 auto's lopen op tot ruim €6.000 aan financieringskosten alleen. En dat is nog de ondergrens: marktprijsdaling, opslagkosten, gemiste verkoopkans en eventuele herprijzing zitten hier niet in.
Dit is een illustratief voorbeeld, geen universele benchmark. Maar het laat zien waarom een paar dagen sneller of trager door de keten meetelt, ook als niemand dat bedrag ooit op een factuur ziet.
Van compound naar showroomvloer: waar de tijd verdwijnt
Die stilstand ontstaat zelden onderweg. Hij ontstaat op het compound: bij het vinden van het juiste voertuig, bij de administratieve vrijgave, bij inspectie- en reconditioneringscapaciteit die op piekmomenten vastloopt. We beschreven die onzichtbare bottleneck in remarketing en het strategisch knooppunt van de voertuiglogistiek al eerder. De rit zelf is meestal niet het probleem. Wat ervoor gebeurt, wel.
Waarom de goedkoopste transportofferte de duurste keuze kan zijn
Dat roept een lastige tegenstelling op: wachten is duur, maar we kiezen vaak toch op transportprijs. De verklaring is dat kosten er wél toe doen, alleen niet op de manier waarop we vaak naar ze kijken.
Het ECG-signaal: kosten zijn in 2026 weer topzorg nummer 1
De branchevereniging ECG onderzocht dit zelf onder vervoerders en opdrachtgevers in de Europese autologistiek. De uitkomst: in 2024 was capaciteit nog de grootste zorg in de sector, met kosten op de tweede plek. In 2026 zijn die plekken gewisseld. Kosten staan nu op nummer 1. Dat is een signaal dat je niet kunt negeren, en het betekent niet dat snelheid er minder toe doet. Het betekent dat de vraag verkeerd gesteld wordt als je prijs en snelheid als elkaars tegenpolen behandelt.
Total cost to sale, niet transportprijs alleen
De vraag die wél telt, is niet "wat kost dit transport", maar "wat kost het om deze auto verkoopklaar te krijgen". Dat is de transportprijs plus financiering, plus opslag, plus het risico op waardedaling, plus de verkoopdagen die je misloopt terwijl de auto nog onderweg is. Een goedkope offerte die drie dagen langer duurt, is zelden de goedkope keuze als je op die manier telt.
De echte bottleneck zit in de afstemming vóór de rit
Een transportwagen kan maar een beperkt aantal kilometers per dag rijden, hoe je het ook plant. De grootste tijdwinst zit daarom meestal vóór de rit, in alles wat aan het vertrek voorafgaat.
Diezelfde ECG-branchevereniging bevestigt dat. Vervoerders noemen korte inplanningstermijnen en boetes bij het niet halen van afspraken als hun grootste zorg rond doorlooptijd, sterker dan twee jaar geleden. Opdrachtgevers klagen vooral over onduidelijke levertijden. En operationeel blijven te veel los- en laadpunten en veelvuldige wijzigingen het grootste knelpunt. Geen van die knelpunten zit in de rijtijd zelf. Ze zitten in de afstemming ervoor: matching, documentatie, wachttijd bij op- en overslagpunten.
Dat is precies waar spotfilling verschil maakt. In plaats van een vaste plek op een transporter te reserveren, gaat je voertuig mee op een route die er al is. Je wacht niet tot er genoeg volume is voor een eigen rit, en de transporteur rijdt niet halfvol. Voeg daar realtime zicht op status en planning aan toe, en de wachttijd die voorheen verstopt zat tussen veiling, compound en aflevering, wordt zichtbaar en dus stuurbaar. We schreven eerder al over hoe dwell time een verborgen kostenpost is in remarketing, en over hoe dealergroepen vervoerbeheer steeds vaker digitaliseren om precies deze afstemming te versnellen.
Wat dit betekent voor autodealers, platforms en fleetowners
Concreet vertaalt dit zich naar drie meetpunten die meer zeggen dan de transportprijs alleen:
- Tijd tussen aankoop en ophalen. De tijd voordat een gekocht voertuig daadwerkelijk wordt opgehaald.
- Tijd tussen ophalen en verkoopklaar. Het aantal dagen tussen aflevering en het moment dat de auto daadwerkelijk in de showroom of online staat.
- Totale doorlooptijd tot verkoop. Het totale aantal dagen tussen aankoop en verkoop, en waar in die keten de meeste tijd verstopt zit.
Wie deze drie punten scherp in beeld heeft, stuurt op wat een voertuig écht kost tot het verkocht is. De transportfactuur alleen is dan niet langer het uitgangspunt.
Veelgestelde vragen
Wat is dwell time in autotransport?
Dwell time is de tijd tussen het moment dat een voertuig administratief beschikbaar is (bijvoorbeeld na veilingverkoop) en het moment dat het fysiek van het compound vertrekt. Het is niet hetzelfde als levertijd naar de eindklant. Dwell time zit vóór het transport, niet erin.
Hoe verkort spotfilling de doorlooptijd?
Spotfilling combineert je zending met een route die er al is, in plaats van te wachten tot er genoeg volume is voor een eigen rit. Daardoor wordt een voertuig sneller ingepland en hoeft de transporteur niet halfvol te rijden.
Is transportprijs of transportsnelheid belangrijker voor je marge?
Geen van beide alleen. De vraag die telt, is wat een voertuig in totaal kost tot het verkocht is: transportprijs plus financiering, opslag, waarderisico en gemiste verkoopdagen. Een goedkope offerte die de doorlooptijd verlengt, is zelden de goedkoopste keuze als je zo rekent.
Snelheid organiseren, geen toeval laten zijn
De transportfactuur is zichtbaar. De kosten van wachten zijn dat niet, maar ze tellen net zo hard mee. Wie grip wil op marge in een markt die drukker en transparanter wordt, kijkt daarom naar de hele weg van aankoop tot verkoop, niet alleen naar de prijs per rit. Bij autodealers en fleetowners die met TransConnect werken, begint dat met zicht op waar in die weg de tijd nu verdwijnt.